Author : Vivek Vardhan Varanasi
Introduction to Talend Activity Monitoring Console
Talend Activity Monitoring Console is an add-on tool integrated in the studio and in Talend Administration Center for monitoring Talend Jobs and projects.
Talend Activity Monitoring Console helps Talend product administrators or users to achieve enhanced resource management and improved process performances through a convenient graphical interface and a supervising tool.
Talend Activity Monitoring Console provides detailed monitoring capabilities that can be used to consolidate the collected activity monitoring information, understand the underlying component and Job interaction, prevent faults that could be unexpectedly generated and support system management decisions.
How to Navigate to AMC

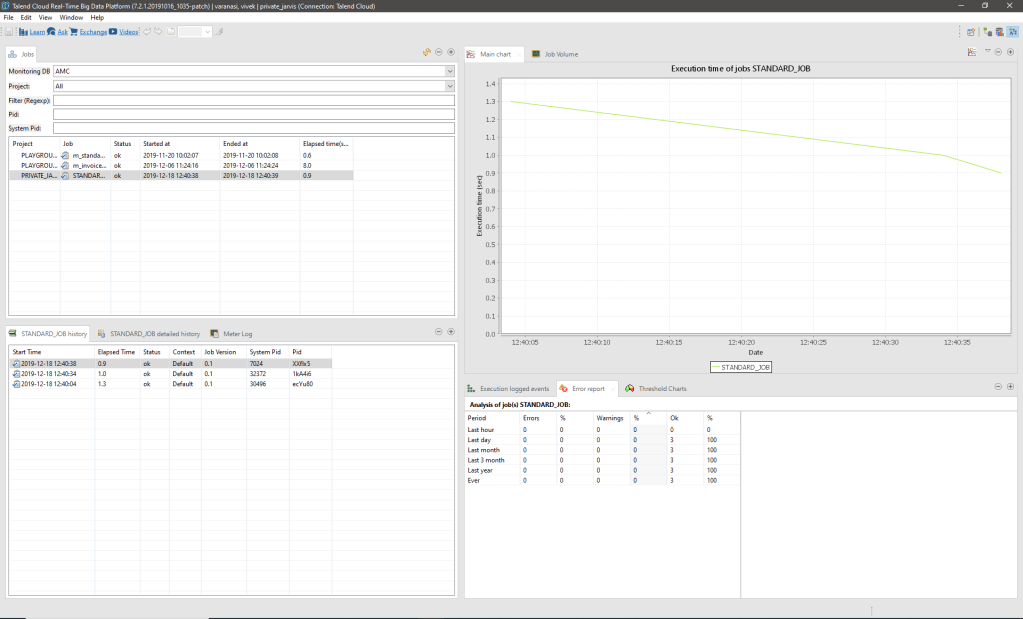
The Talend Activity Monitoring Console interface consists of the following views:
- Jobs view,
- History and Detailed history views,
- Meter log view,
- Main chart view,
- Job Volume view,
- Logged Events view,
- Error report view,
- Threshold Charts view.
Configuration
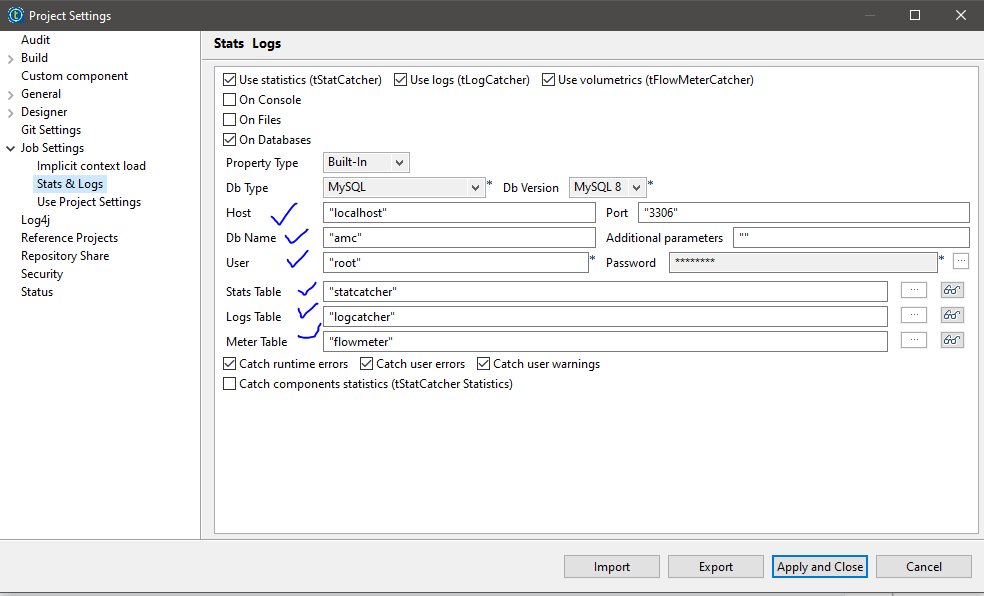
AMC can be configured from your Talend Studio
AMC can be configured from Files or Database. We recommend to use Database.

AMC primarily works based on 3 Tables
- flowmeter
- logcatcher
- statcatcher
MySQL Query to create tables
Flow Meter :
flowmeter, CREATE TABLE flowmeter (
moment datetime DEFAULT NULL,
pid varchar(20) DEFAULT NULL,
father_pid varchar(20) DEFAULT NULL,
root_pid varchar(20) DEFAULT NULL,
system_pid bigint(8) DEFAULT NULL,
project varchar(50) DEFAULT NULL,
job varchar(255) DEFAULT NULL,
job_repository_id varchar(255) DEFAULT NULL,
job_version varchar(255) DEFAULT NULL,
context varchar(50) DEFAULT NULL,
origin varchar(255) DEFAULT NULL,
label varchar(255) DEFAULT NULL,
count int(3) DEFAULT NULL,
reference int(3) DEFAULT NULL,
thresholds varchar(255) DEFAULT NULL
) ENGINE=InnoDB DEFAULT CHARSET=latin1
Log Catcher
logcatcher, CREATE TABLE logcatcher (
moment datetime DEFAULT NULL,
pid varchar(20) DEFAULT NULL,
root_pid varchar(20) DEFAULT NULL,
father_pid varchar(20) DEFAULT NULL,
project varchar(50) DEFAULT NULL,
job varchar(255) DEFAULT NULL,
context varchar(50) DEFAULT NULL,
priority int(3) DEFAULT NULL,
type varchar(255) DEFAULT NULL,
origin varchar(255) DEFAULT NULL,
message varchar(255) DEFAULT NULL,
code int(3) DEFAULT NULL
) ENGINE=InnoDB DEFAULT CHARSET=latin1
Stat Catcher
statcatcher, CREATE TABLE statcatcher (
moment datetime DEFAULT NULL,
pid varchar(20) DEFAULT NULL,
father_pid varchar(20) DEFAULT NULL,
root_pid varchar(20) DEFAULT NULL,
system_pid bigint(8) DEFAULT NULL,
project varchar(50) DEFAULT NULL,
job varchar(255) DEFAULT NULL,
job_repository_id varchar(255) DEFAULT NULL,
job_version varchar(255) DEFAULT NULL,
context varchar(50) DEFAULT NULL,
origin varchar(255) DEFAULT NULL,
message_type varchar(255) DEFAULT NULL,
message varchar(255) DEFAULT NULL,
duration bigint(8) DEFAULT NULL
) ENGINE=InnoDB DEFAULT CHARSET=latin1
MS SQL Server
CREATE TABLE amc.statcatcher(
moment datetime NULL,
pid varchar(20) NULL,
father_pid varchar(20) NULL,
root_pid varchar(20) NULL,
system_pid bigint NULL,
project varchar(50) NULL,
job varchar(255) NULL,
job_repository_id varchar(255) NULL,
job_version varchar(255) NULL,
context varchar(50) NULL,
origin varchar(255) NULL,
message_type varchar(255) NULL,
message varchar(255) NULL,
duration bigint NULL
) ON PRIMARY
GO
CREATE TABLE amc.logcatcher(
moment datetime NULL,
pid varchar(20) NULL,
root_pid varchar(20) NULL,
father_pid varchar(20) NULL,
project varchar(50) NULL,
job varchar(255) NULL,
context varchar(50) NULL,
priority int NULL,
type varchar(255) NULL,
origin varchar(255) NULL,
message varchar(255) NULL,
code int NULL
) ON PRIMARY
GOOnce Tables are created – following – make sure all the connections are correct.
To View AMC in Studio – few more steps needs to be done

Click on Activity Monitoring console -> Datasource Type -> Add button
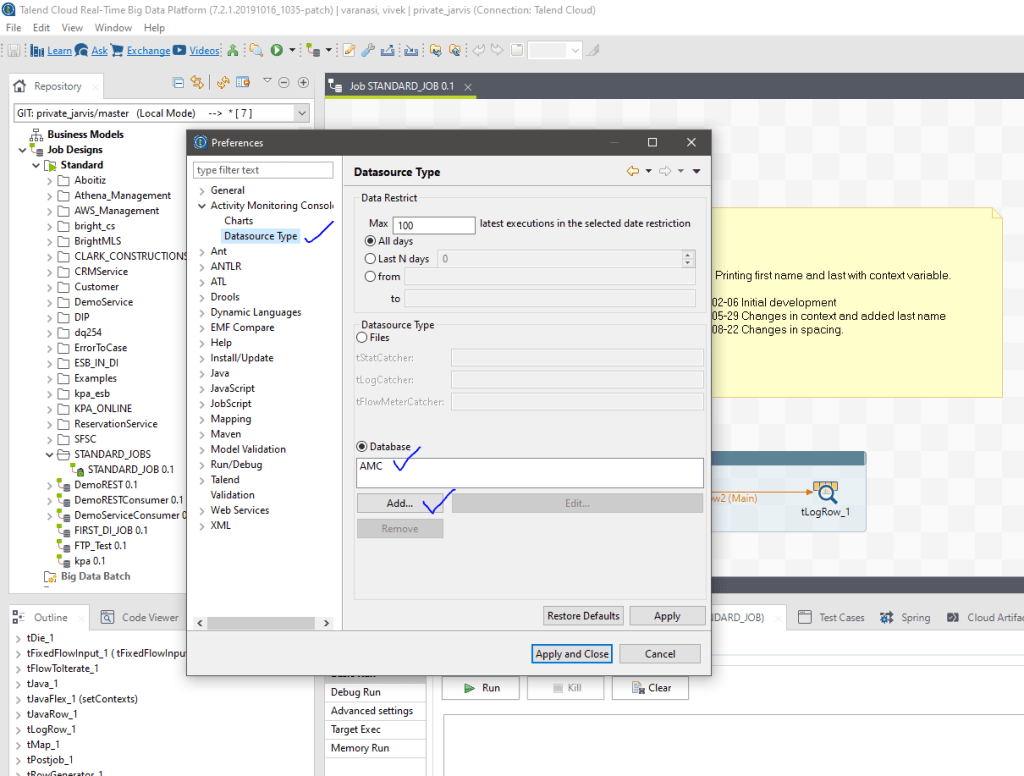
And configure database

